How Mueller Competes in the Pasta Category – An NBD-Dirichlet Analysis
Analyze brand performance for the Pasta category and employ the Dirichlet model to evaluate purchasing behaviors in the market.
1. Introduction
1.1 Project Overview
Analyze brand performance for the Pasta category and employ the Dirichlet model to evaluate purchasing behaviors in the market.
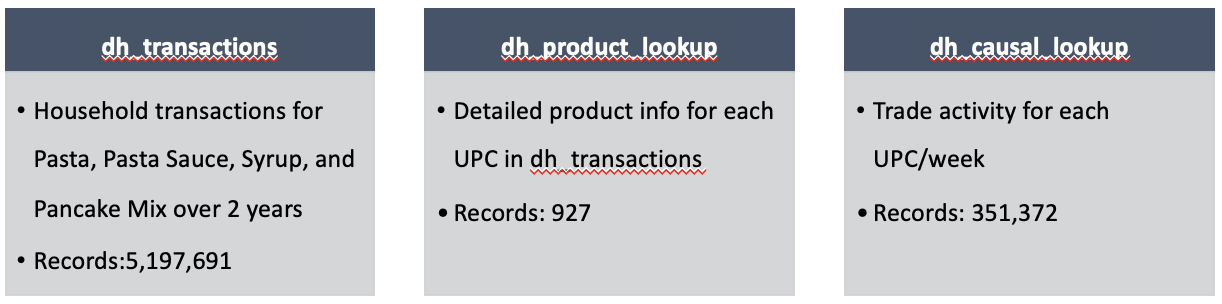
1.2 Dataset overview
2. Key Performance Metrics for ‘MUELLER’ Brand
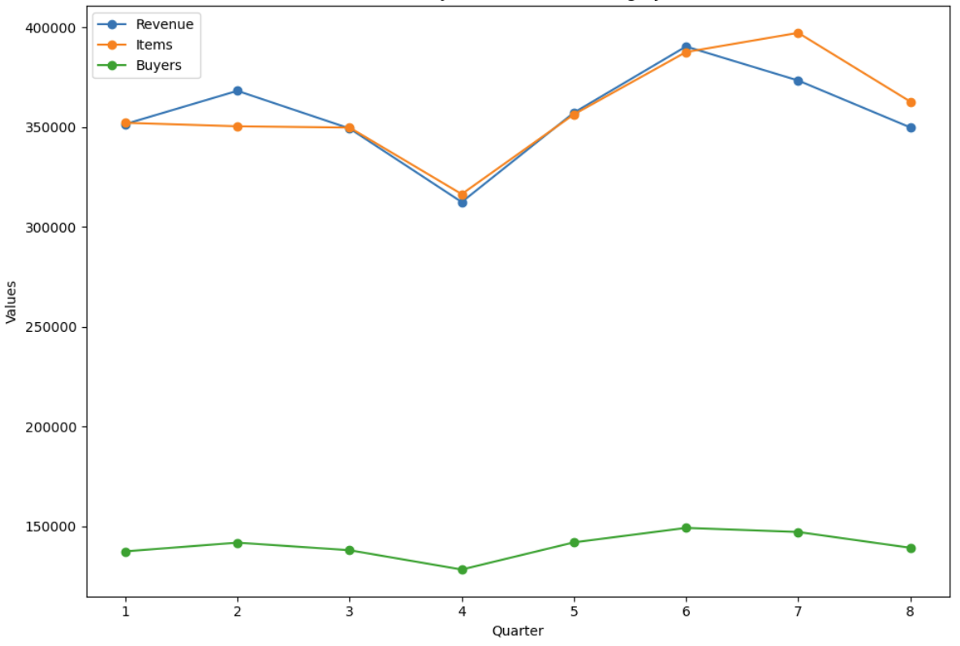
2.1 Sales Performance
Quarterly trends of revenue, items, buyers, purchases, over the two years 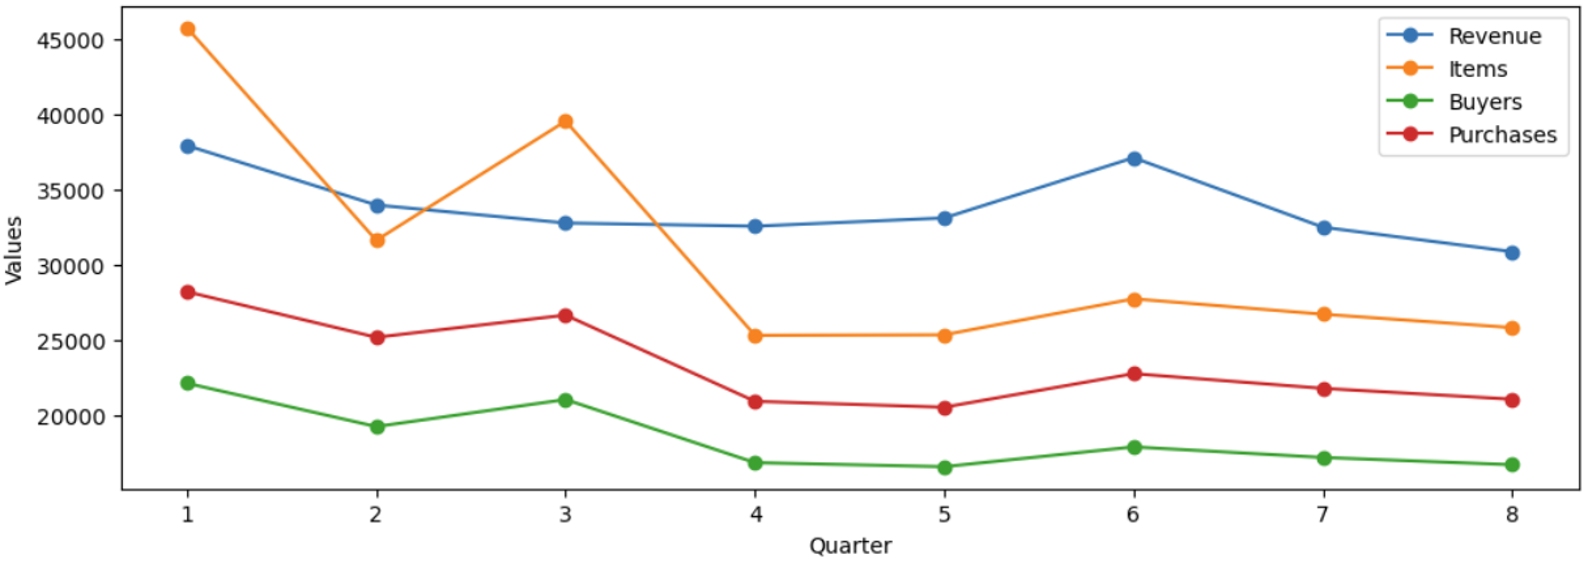
- All of the metrics generally decrease over the quarters, indicating a downward trend in sales and transaction volumes, suggesting declining market interest or increased competition.
- The number of items, buyers, and purchases show an unusual spike in Q3 followed by a decline, which may be related to seasonal factors or promotions.
2.2 Buyer Metrics
Quarterly trends of penetration, purchase frequency, repeat buying rate over two years
- Stable purchase frequency: Purchase frequency remained between 1.2 and 1.3, indicating no significant change in customer behavior.
- Declining Penetration: Penetration declined from 5.4% to 4.1%, indicating a declining ability to attract new customers or retain existing ones.
- Declining repeat buying rate: The repeat buying rate is in line with the penetration trend.
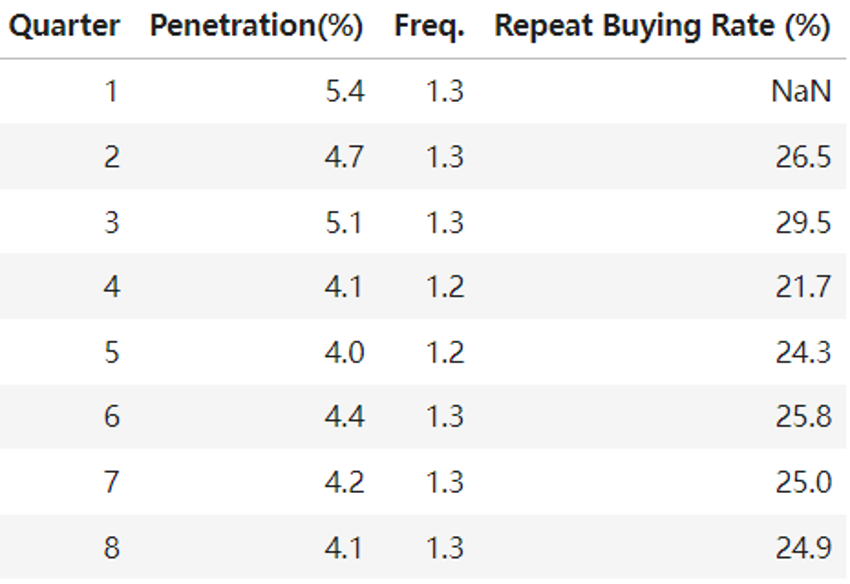
The decline in sales is mainly due to a shrinking customer base,mainly caused by the loss of existing customers,rather than a change in purchasing behavior.
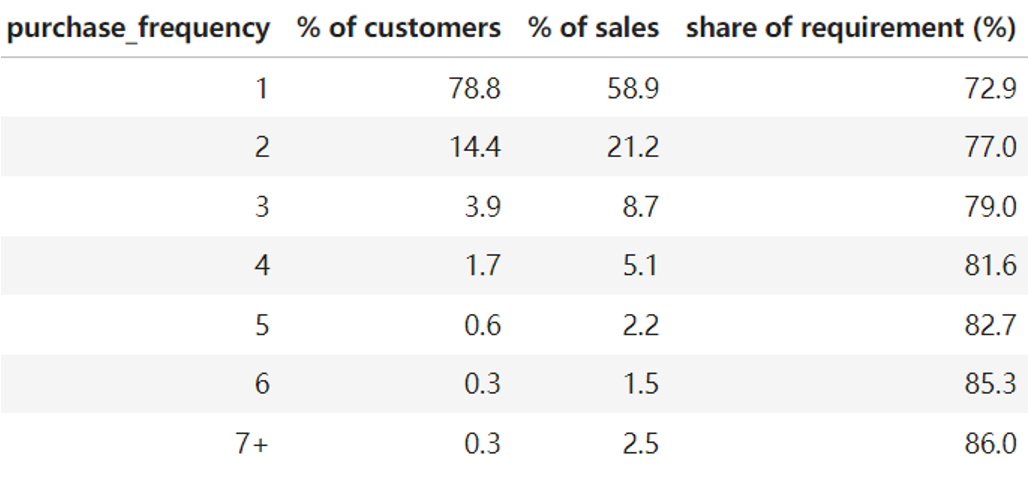
2.3 Buyer Frequency Breakdown
For each buyer class, % of total buyers, % of total revenue, share of requirement in last quarter
- Dominance of light buyers: Customers who make only 1 purchase contribute nearly 60% of sales Loyalty increases with frequency: Customer loyalty increases with frequency of purchase.
- Strong loyalty among light buyers: Even light buyers show strong brand loyalty, ranging from 72.9% to 77%.
- Impact of Heavy Buyers: Although heavy buyers represent only 1.2% of the customer base, they contribute significantly to sales (6.2%) and show high brand loyalty.
3. Competitive Performance in Pasta Category
3.1 All Brands
Total revenue, buyers, penetration over the two years —— Bubble size represents brand households The star icon represents brand Mueller.
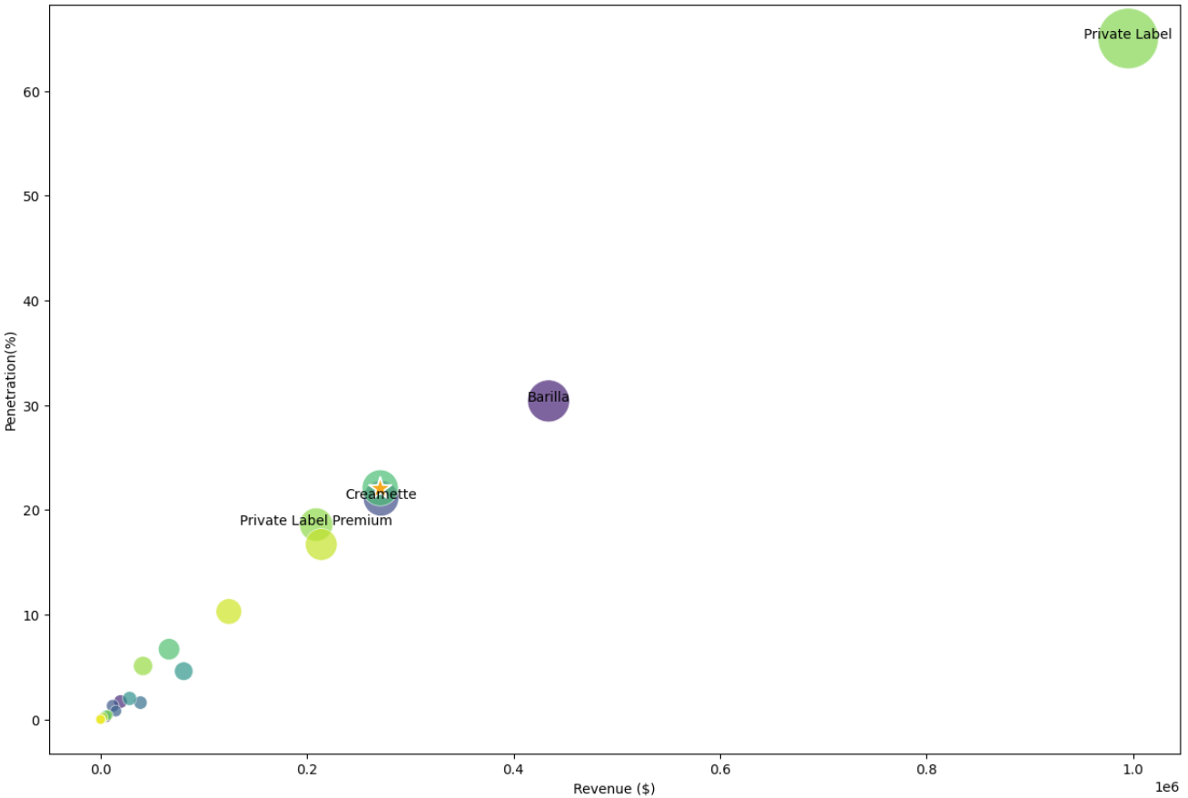 The chart shows the performance of all brands over eight quarters:
- Both revenue and penetration trends align with the number of buyers, indicating the importance of customer base size in driving brand success.
- Private label is the market leader with over 60% market penetration.
- Mueller is centrally positioned and shows potential to grow and expand market share.
3.2 Performance for TOP 10 in Last Quarter
Purchase frequency, penetration, market share in last quarter 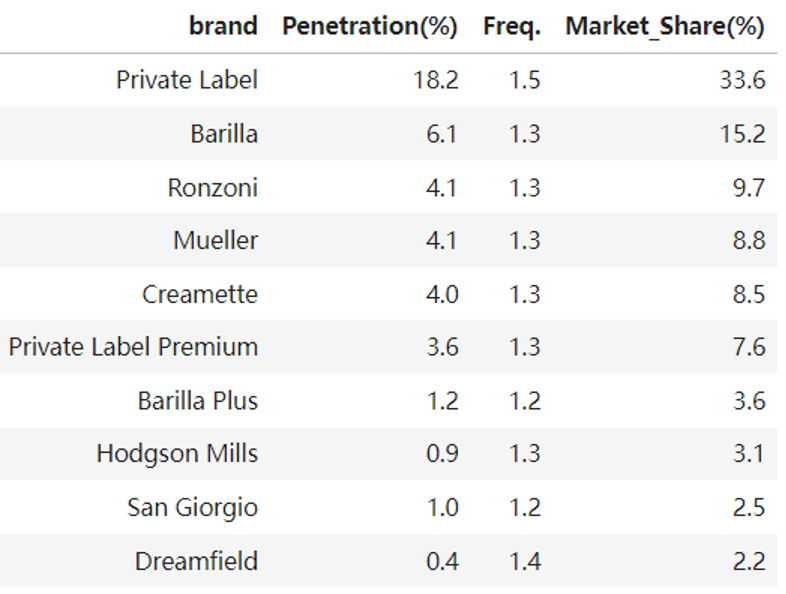
- Purchase frequency is in line with penetration trends.
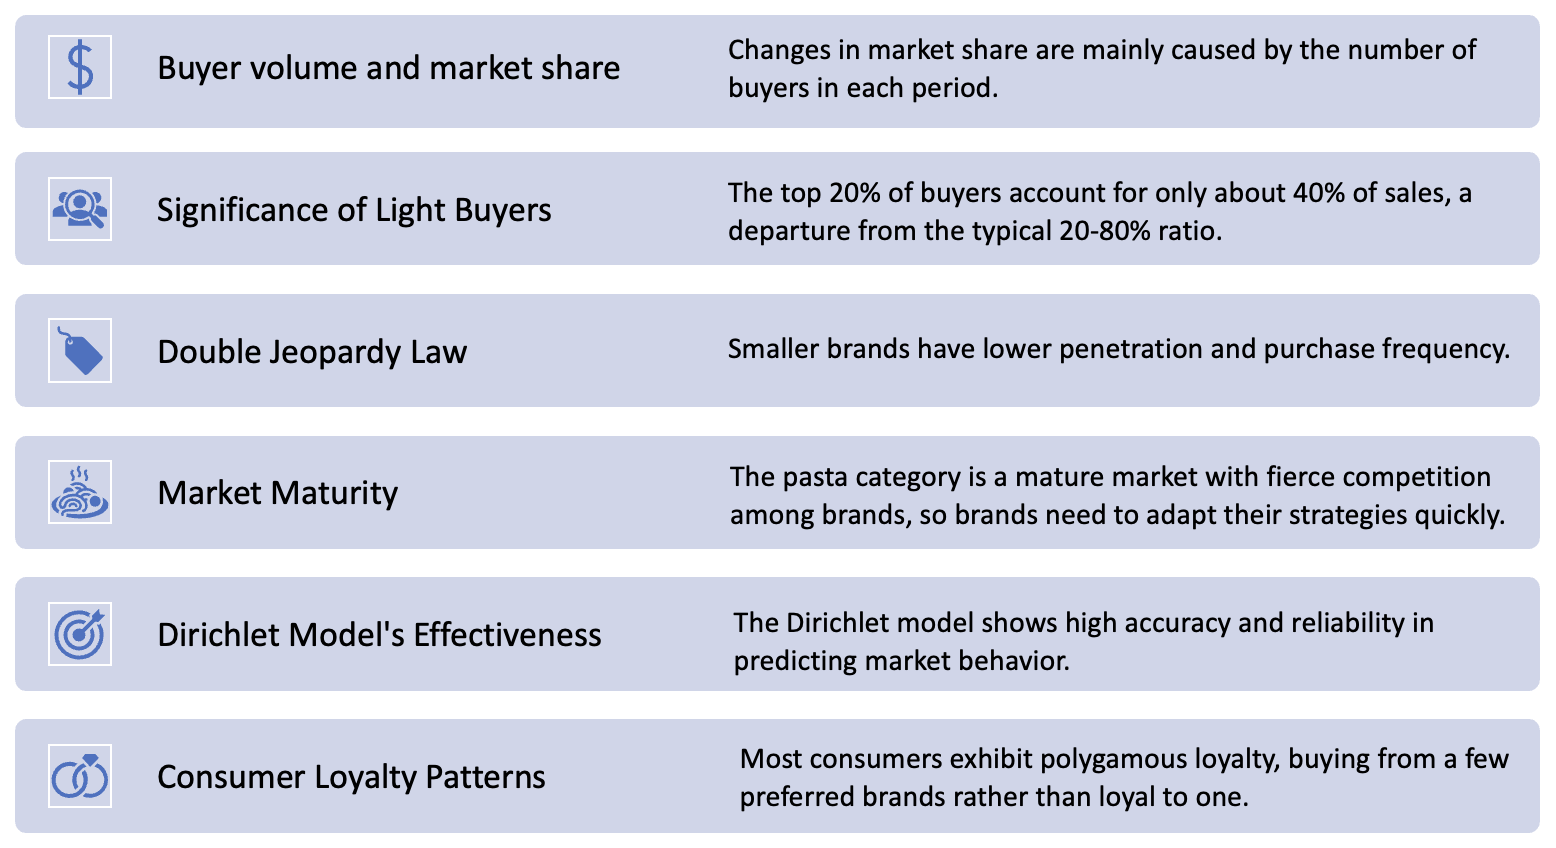
- The data supports the Double Jeopardy Law, showing that smaller brands have both lower market penetration and lower purchase frequency.
4. Key Metrics for Category Demand
4.1 Quarterly Trends for Pasta Category
- Market Maturity: Key indicator trends are stable; pasta category is mature market with settled consumer demand.
- Wobbles in Q4 and Q6: may be related to holiday purchases or promotions.
- Consistent purchase frequency: A regular purchase pattern in the pasta category, highlighting pasta’s essential place in consumers’ diets.
4.2 Market Share(%) of TOP Brands Over Quarters
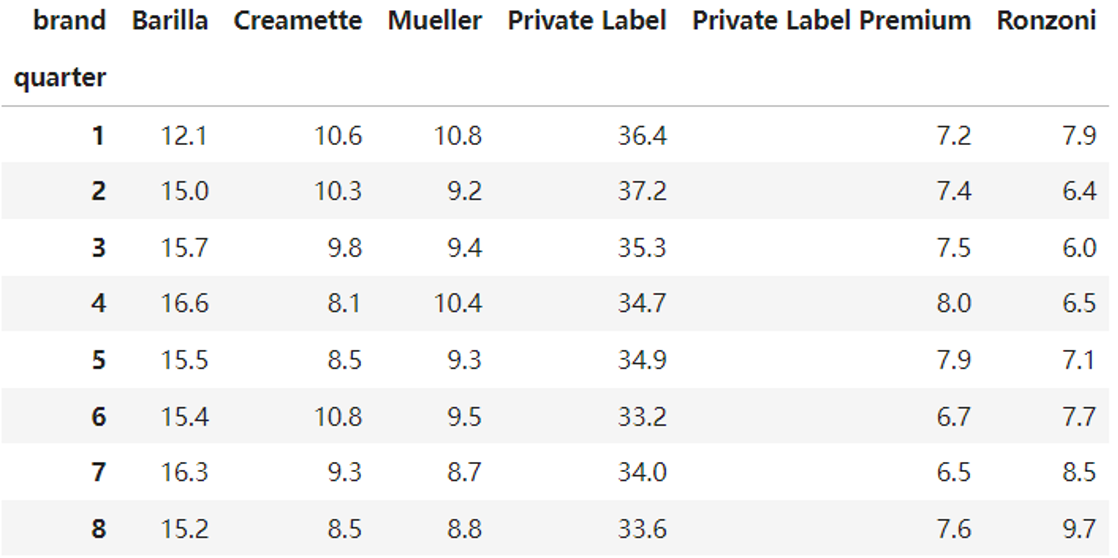
- Private label: Dominate the market, although with a slight decline from around 36% to around 33%.
- Barilla: Expanded its market share from around 12% to around 15%.
- Mueller : With a slight decline over the last 4 quarters.
- Ronzoni: Maintained steady growth in the latter quarters
4.3 Market Share(%) of TOP Brands Over Quarters
The chart shows a dynamic market environment 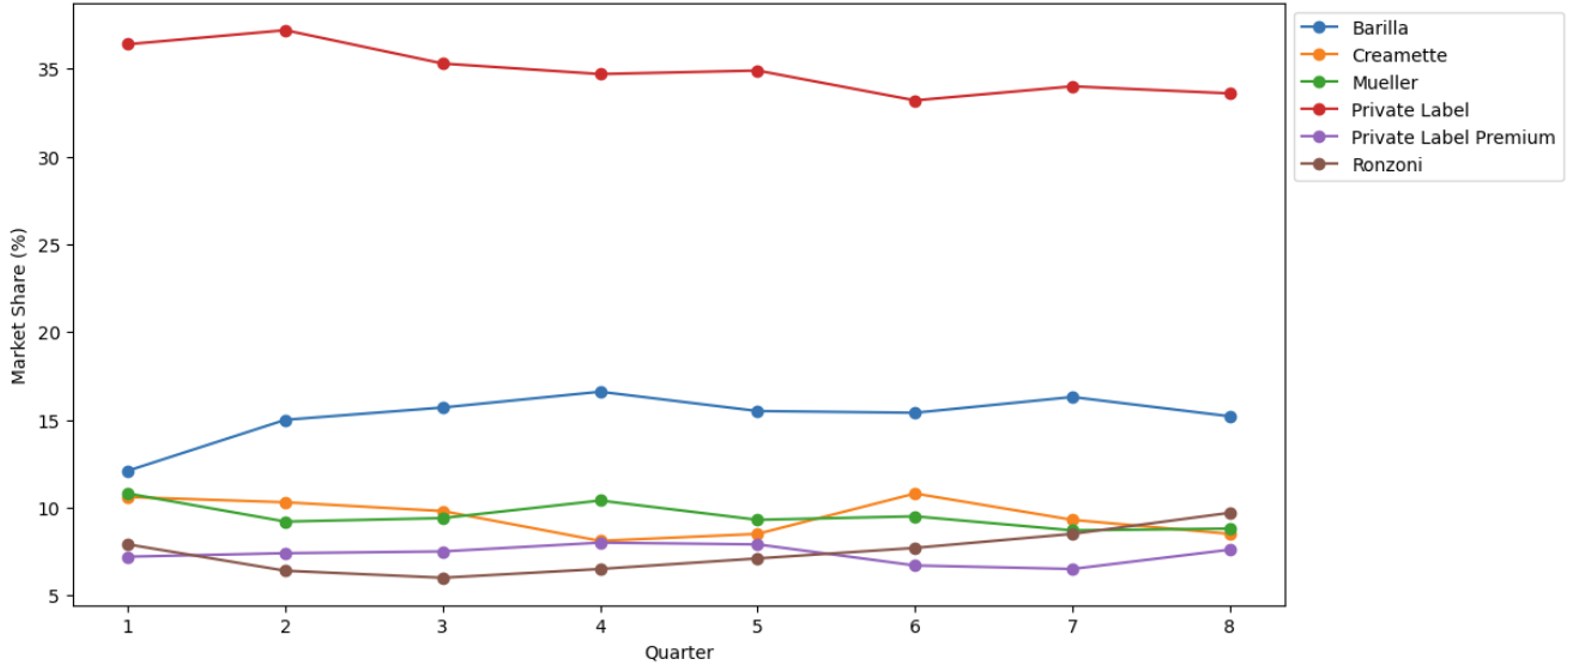
- Private Label leadership is increasingly challenged.
- Meanwhile, Ronzoni’s rapid growth has made it a significant competitor in the market.
- Mueller’s recent decline shows that it’s a crucial time for the brand, and it needs to reevaluate its strategy to meet new market challenges.
5. NBD Dirichlet model
The NBD-Dirichlet model is a statistical model used to understand how often people buy from a category and how they choose between brands.
5.1 Model Input
Using data from the last quarter, the analysis was conducted with Zane Kearns’ Excel-based tool to estimate key brand metrics such as penetration, purchase frequency, and loyalty. 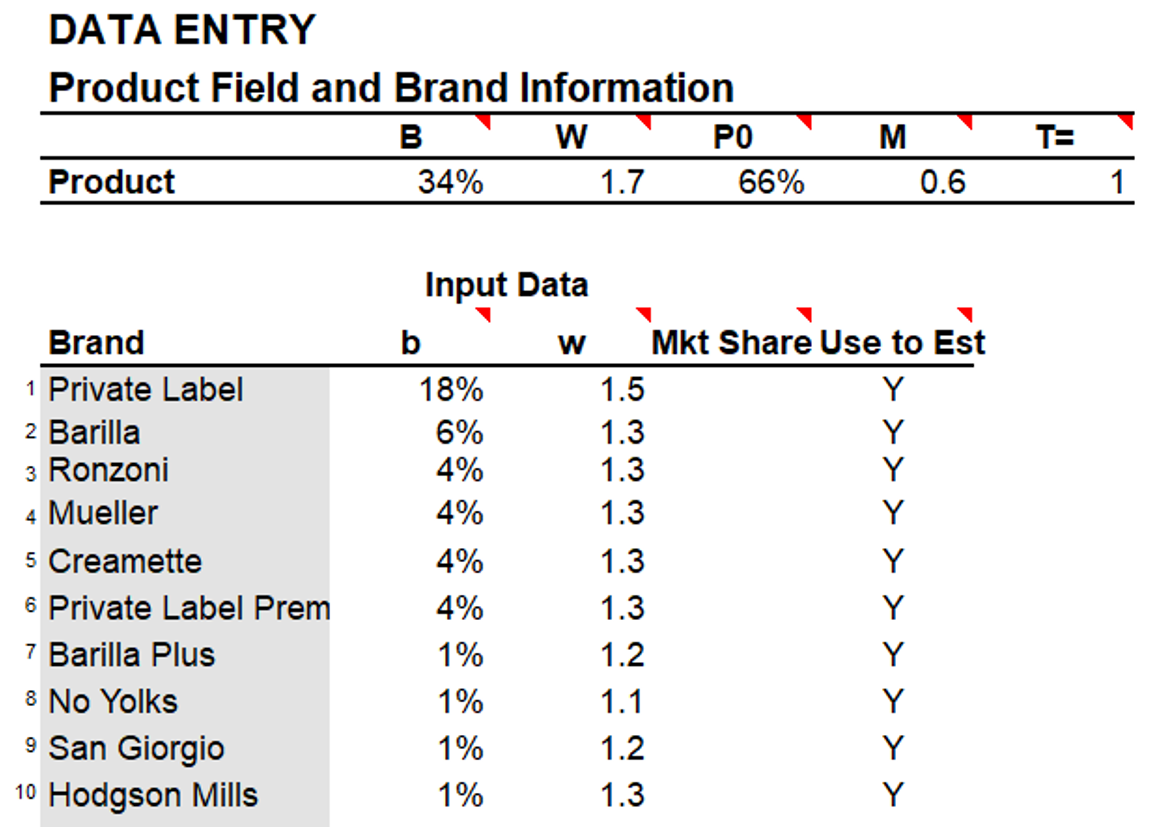
5.2 Model Result
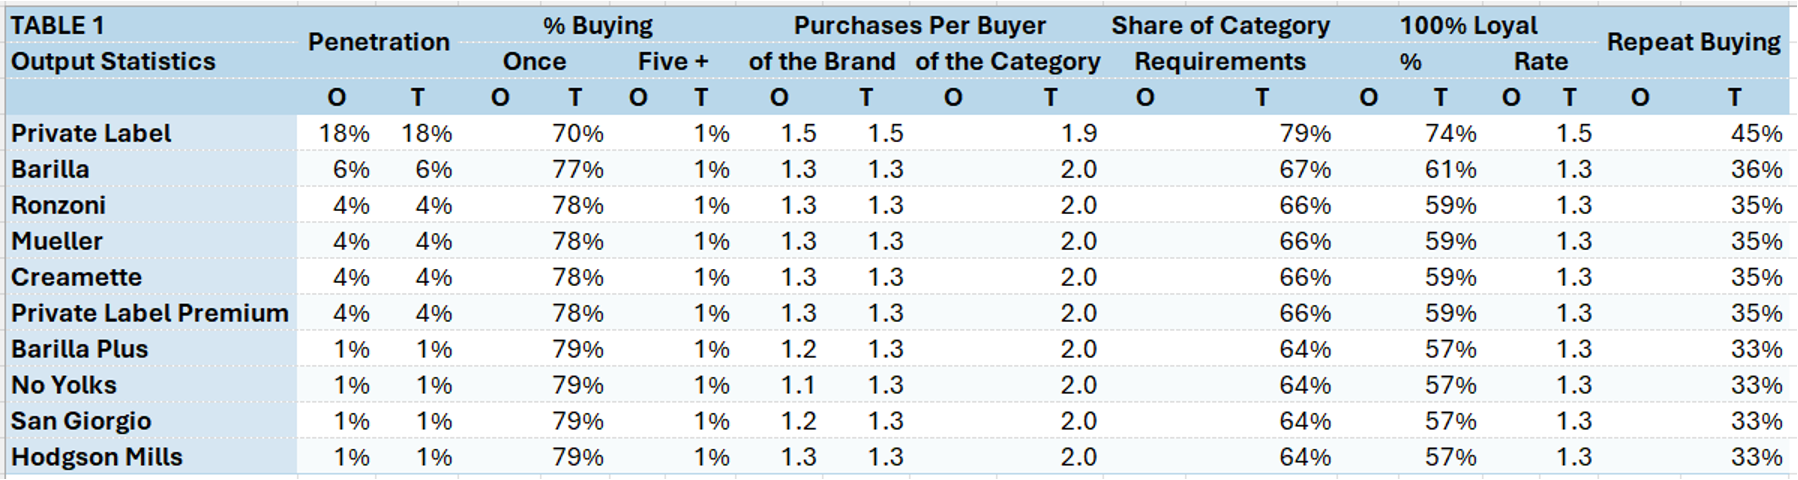
- Model Accuracy: Model with strong predictive capabilities for penetration and purchase per buyer.
- Brand Loyalty: Larger brands show higher loyalty, while smaller brands face a double jeopardy effect .
- Consistent Purchase Behavior: Purchase per buyer is consistent across brands, even for leading brands, indicating that consumer purchasing is driven by lifestyle or category needs rather than brand loyalty.
- Polygamous Loyalty: From SCR(%), consumers show no strong preference for a single brand and spread their purchases across multiple brands.
5.3 Model Fitting Statistics
Model is accuracy and reliability in predicting market behavior 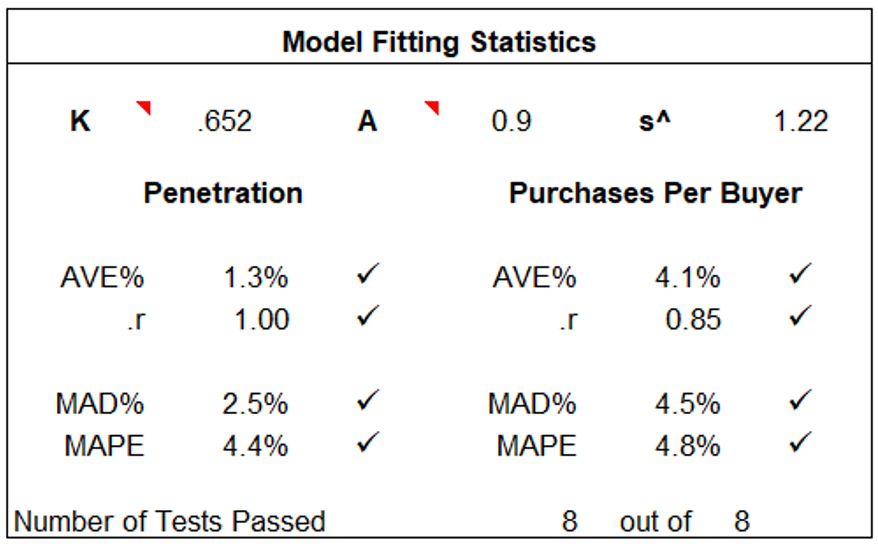
- Correlation coefficient (r): Penetration(1.00) and Purchases Per Buyer(0.85) show a very high positive correlation between predicted and actual values, highlighting the model’s accuracy.
- Error metrics: AVE, MAD and MAPE are all less than 5%, indicating the forecast is acceptably accurate, and the model is highly reliable.
Conclusion